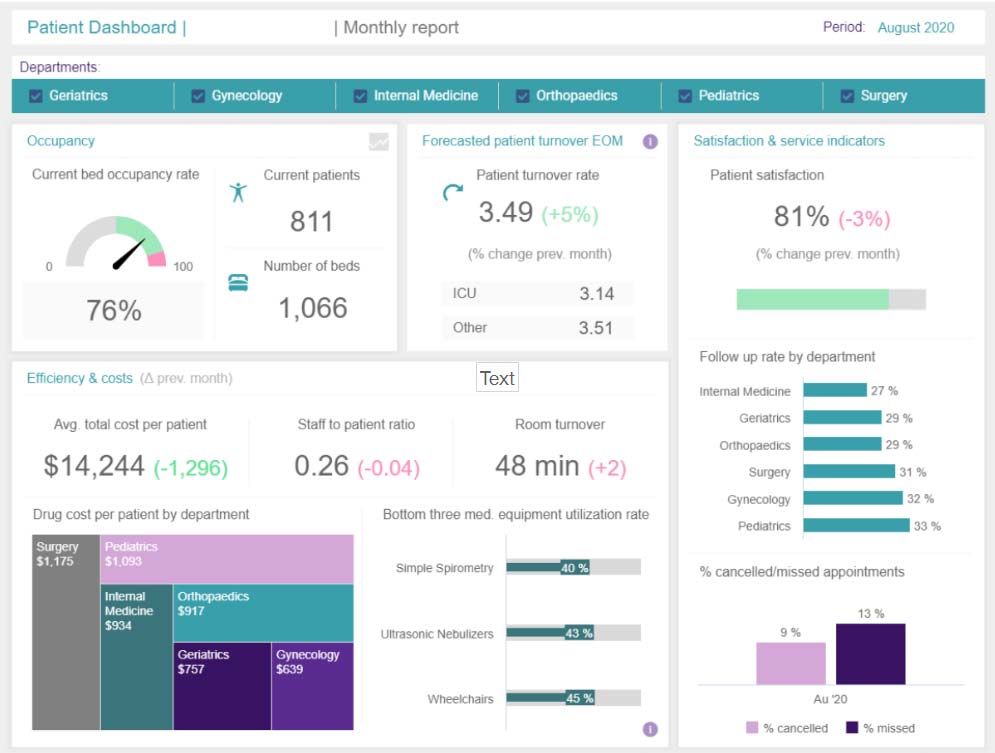
Treatment models have changed & many of these changes are driven by data and the amount of sources to gain insights keeps growing.
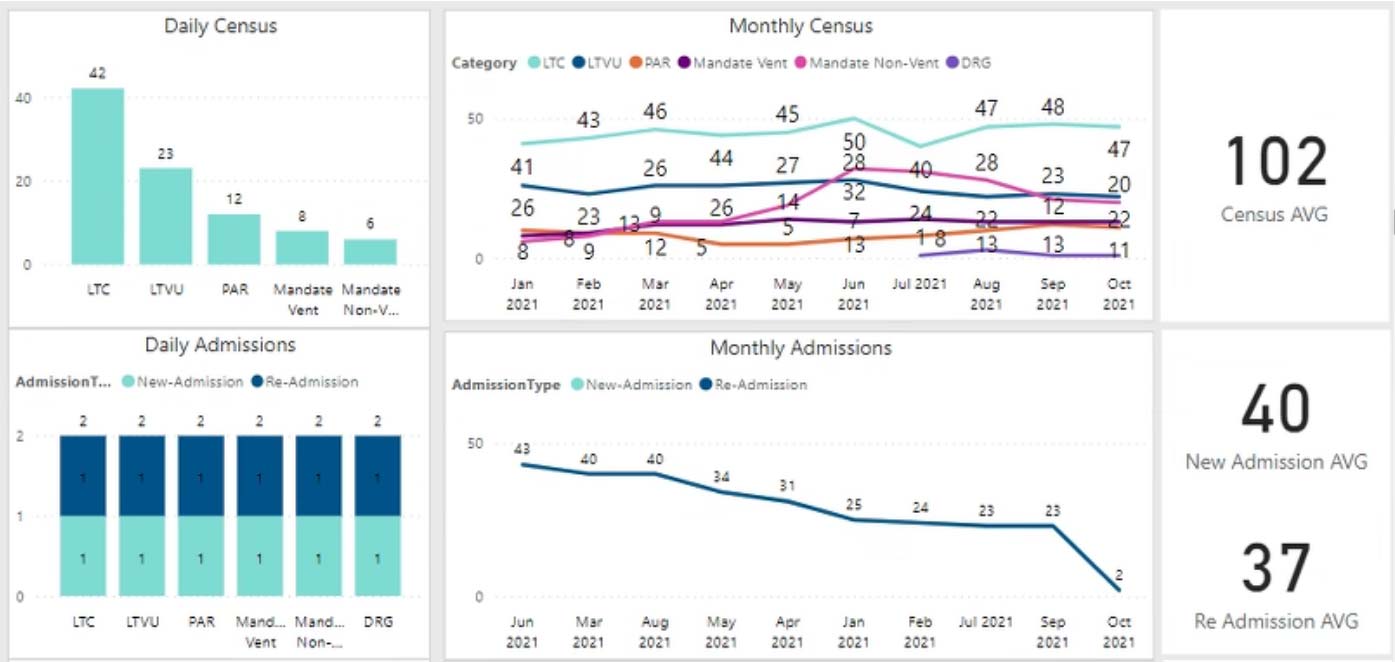 Re-Admission & Census
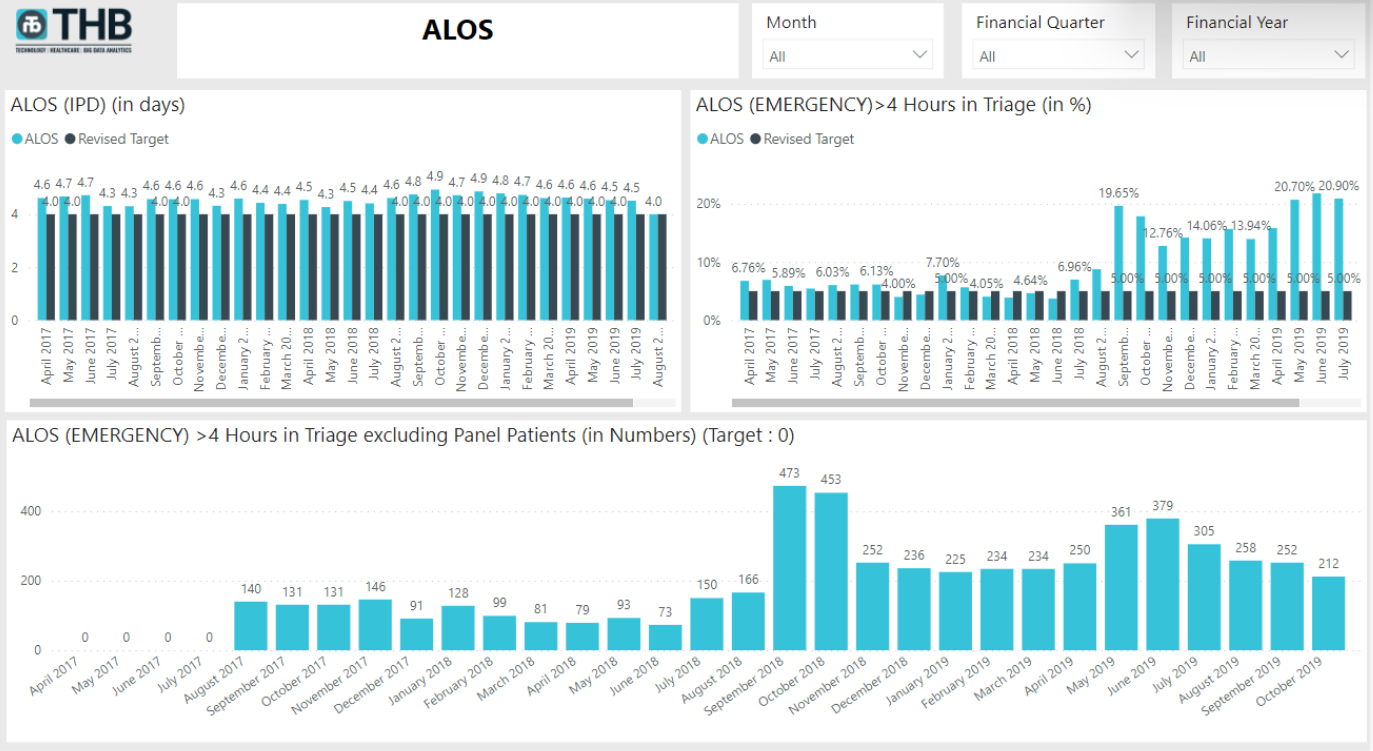 ALOS
ALOS
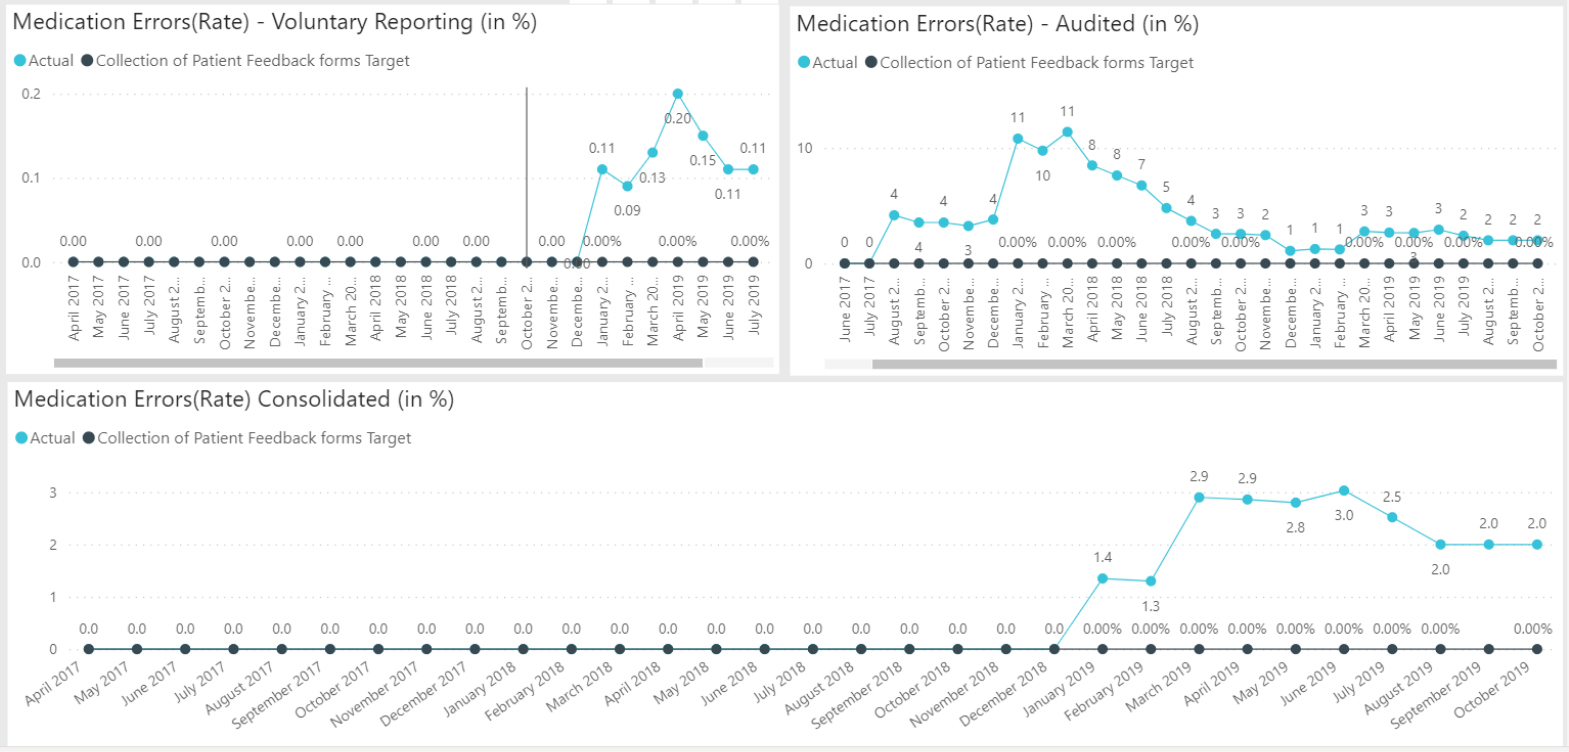 Medication Errors
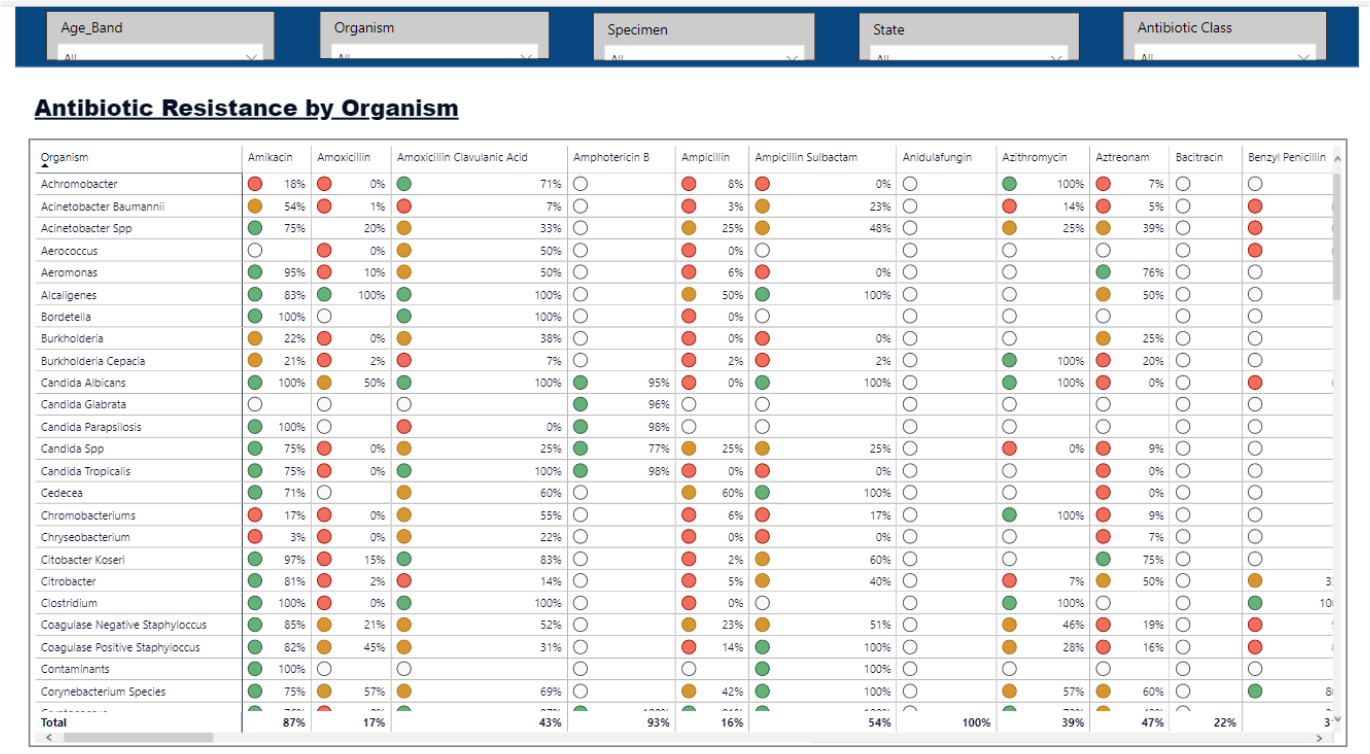 Antibiotic Resistance by Organism
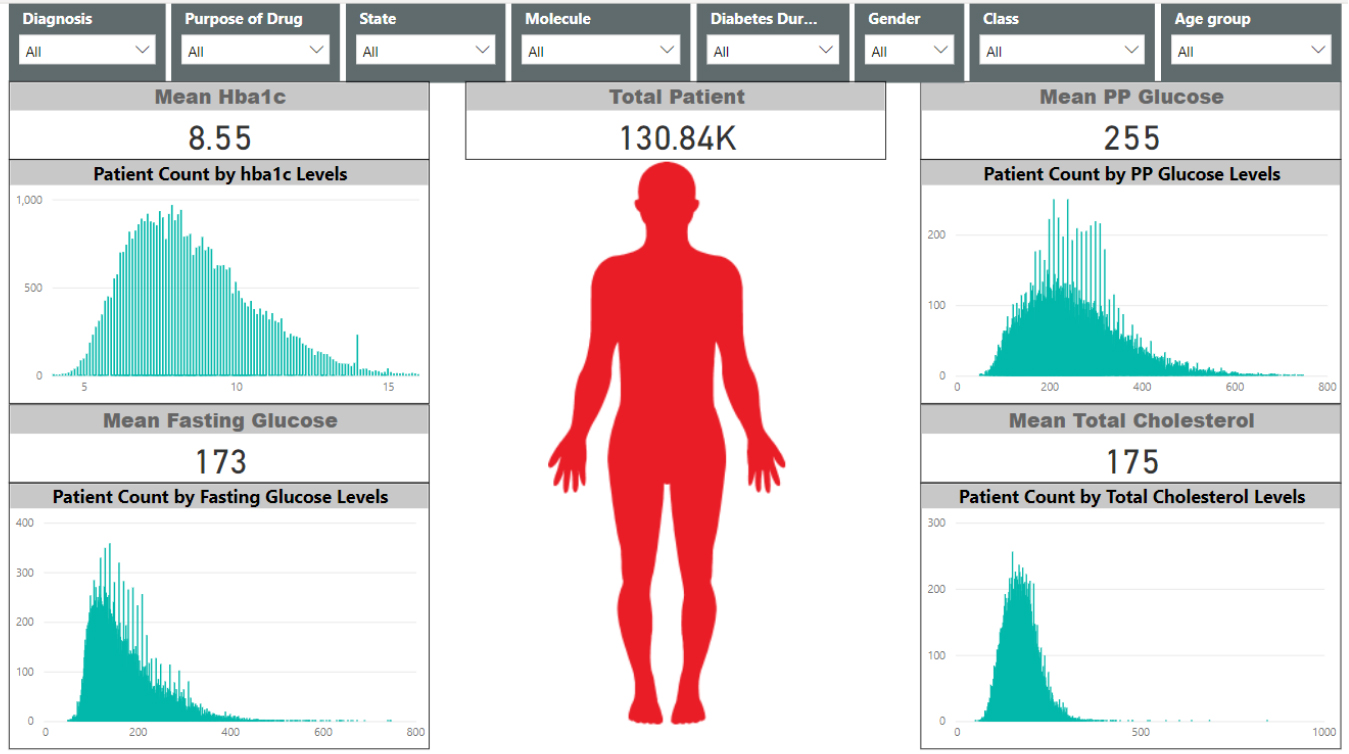 Diabetic Patient Profile
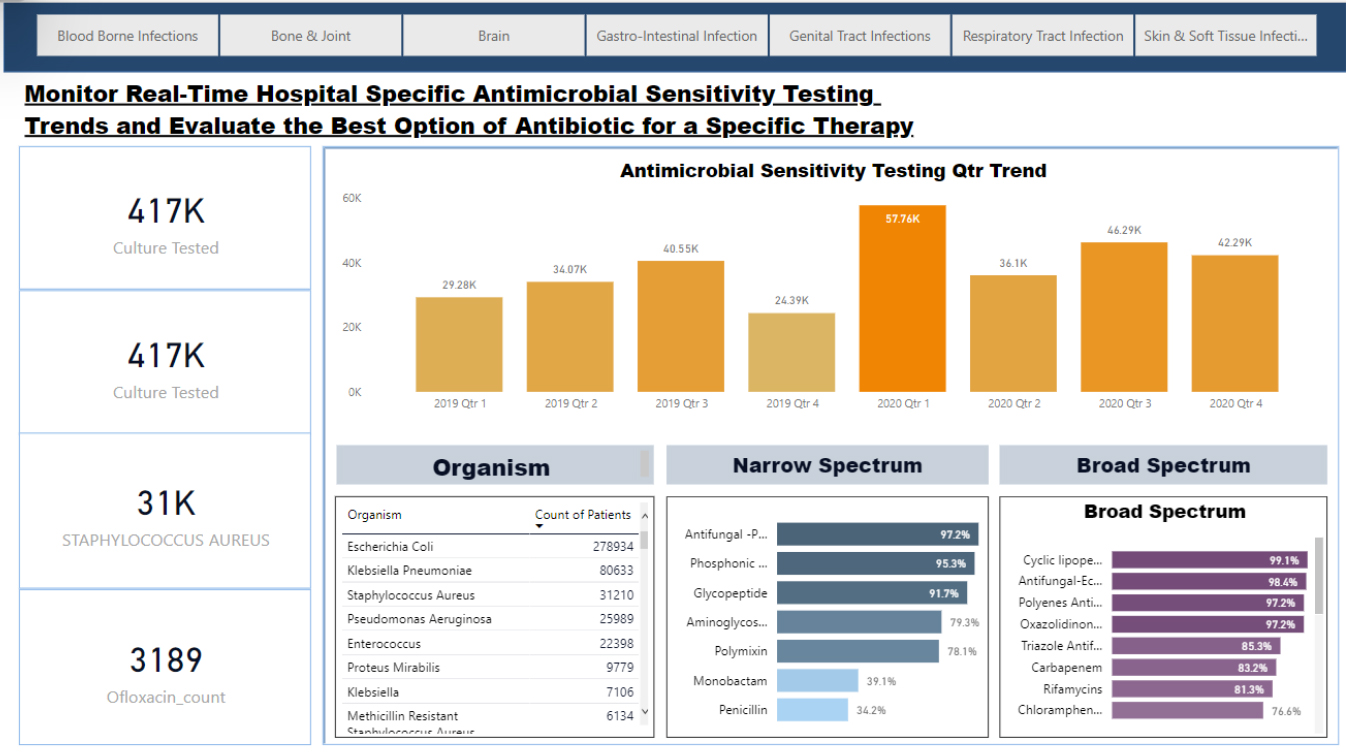 Antimicrobial Sensitivity by Therapy Area
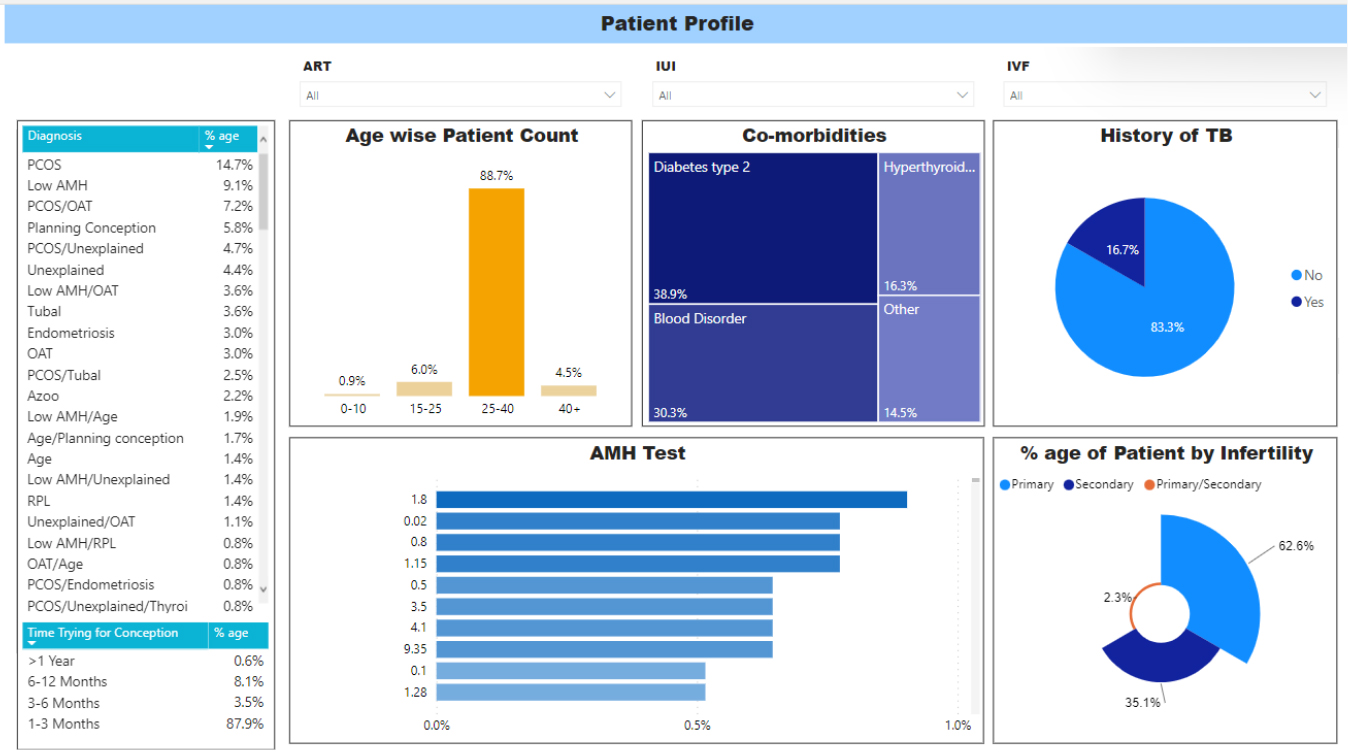 Gina - IVF Patient Profile
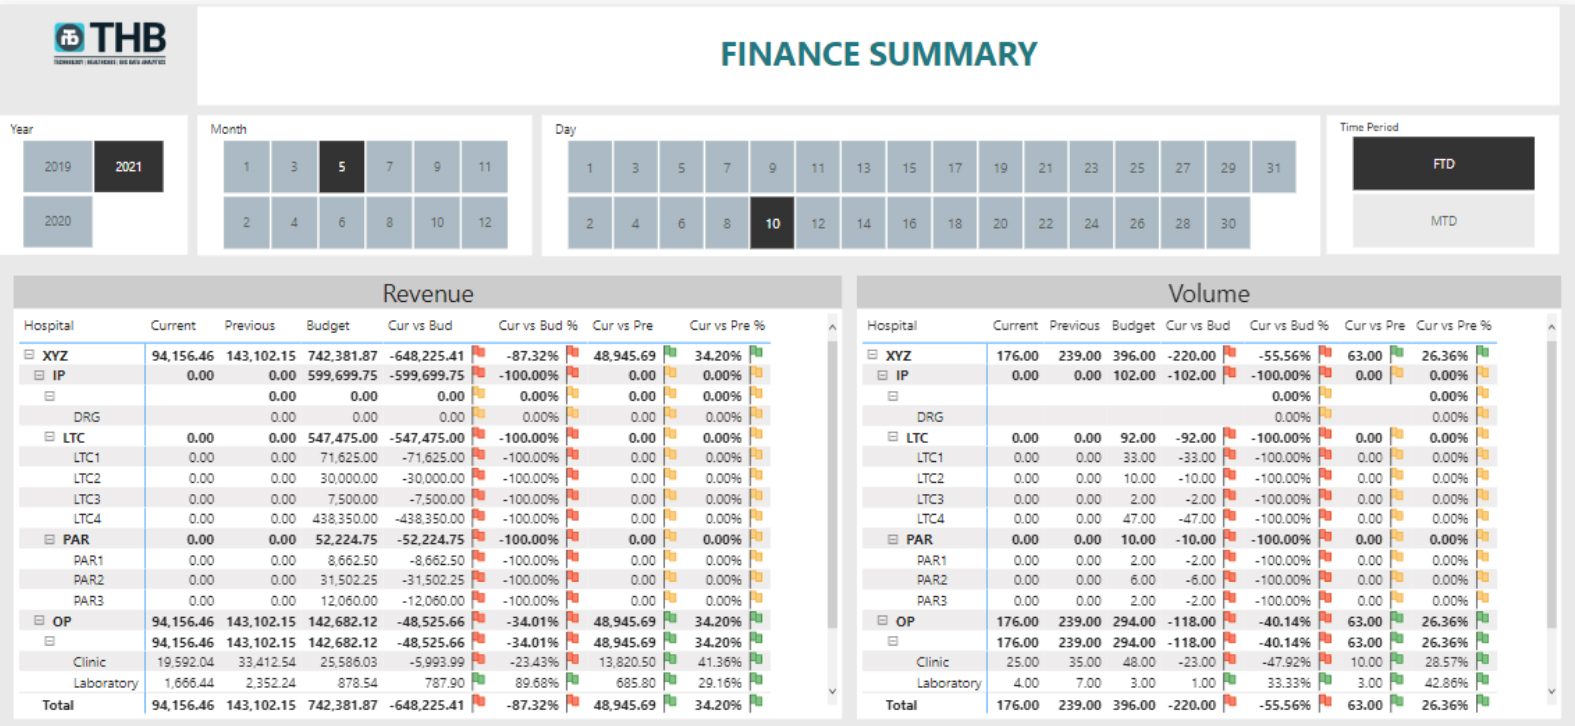 Summary
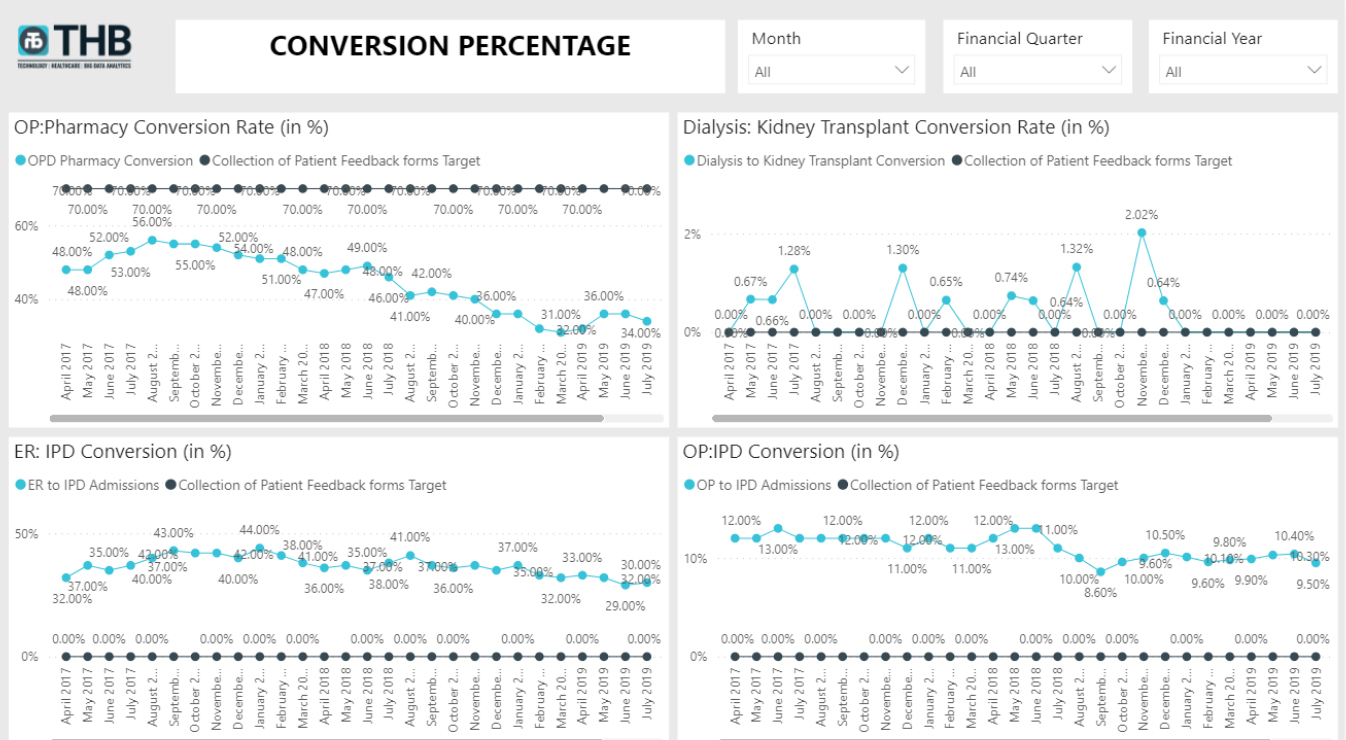 Conversion
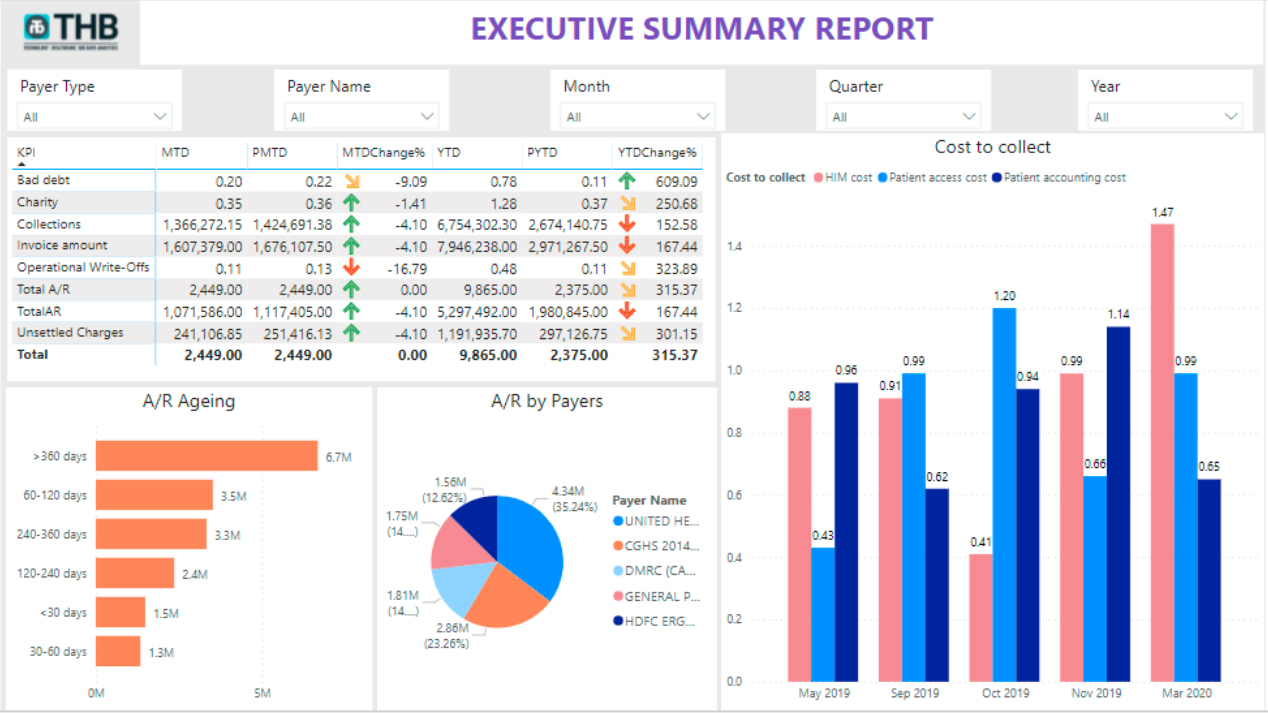 Revenue Cycle Management
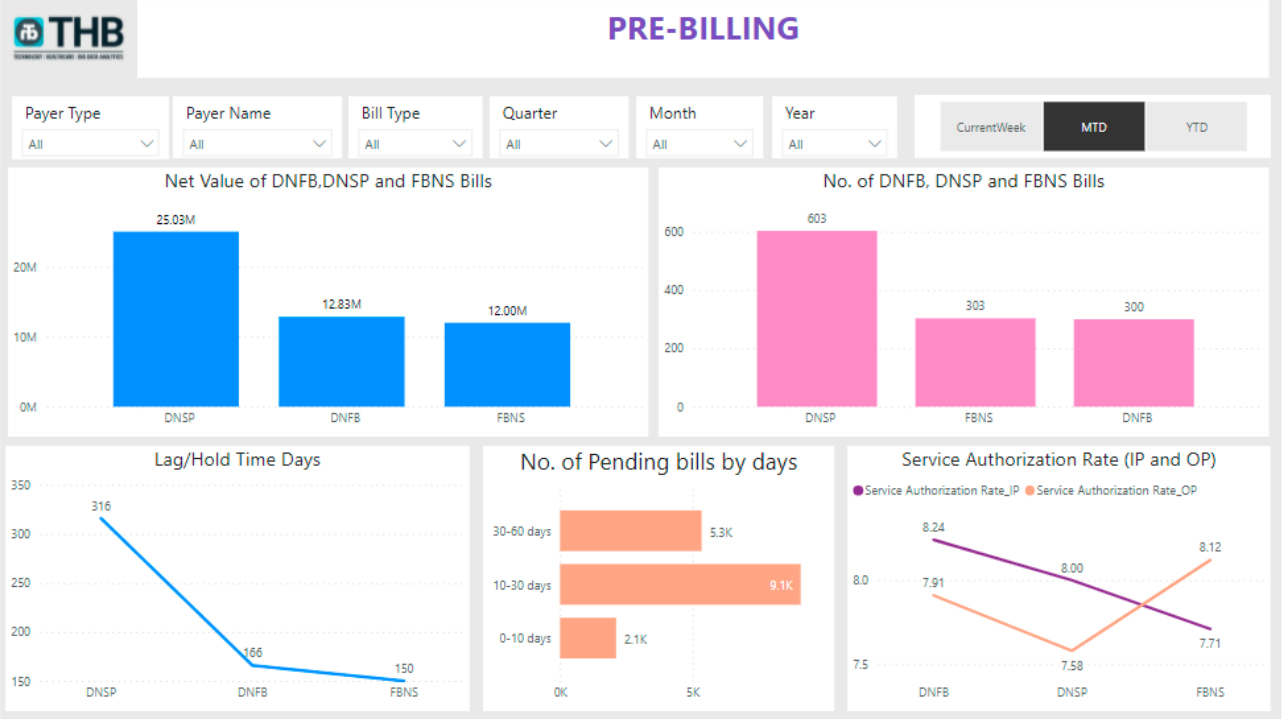 Revenue Cycle Management
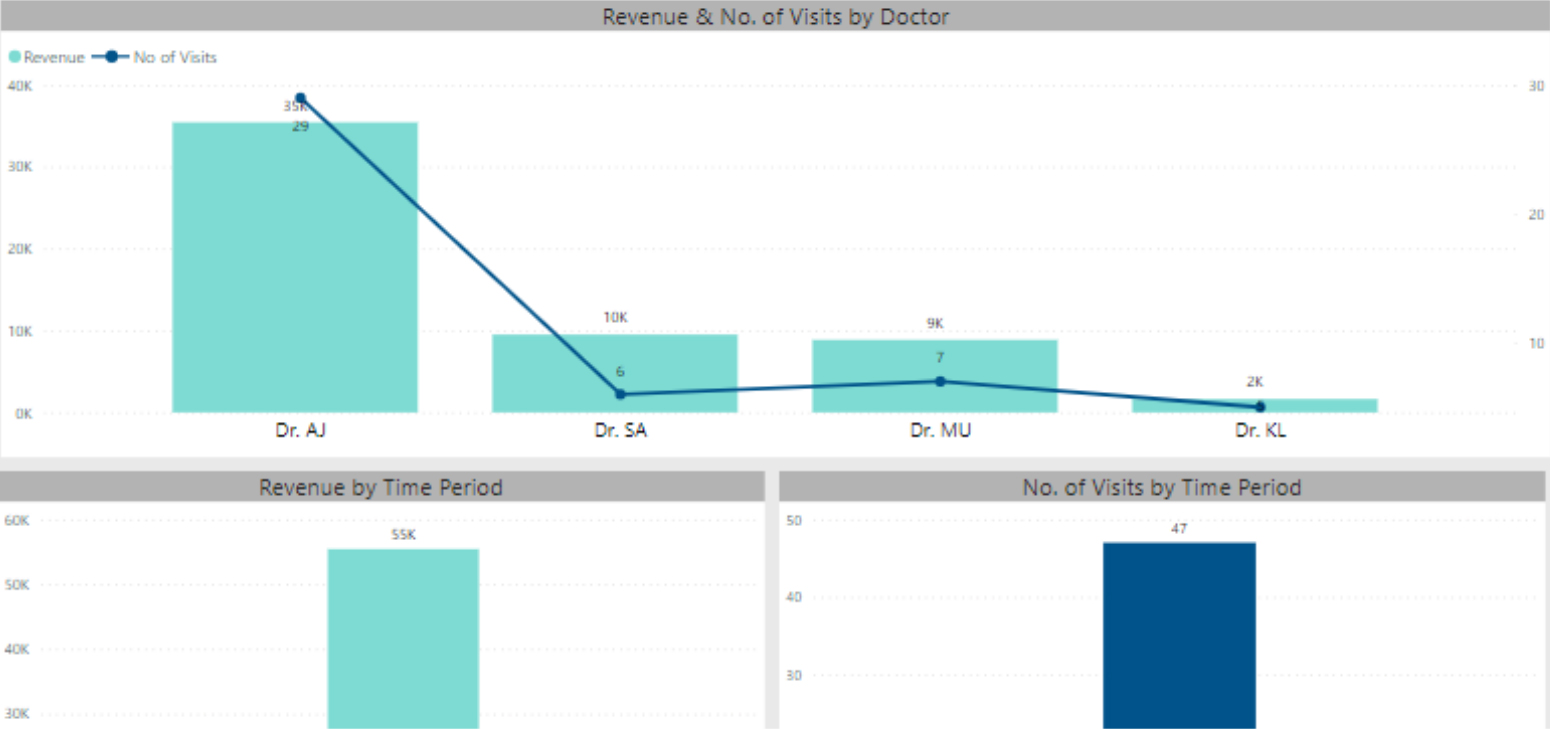 Physician Productivity
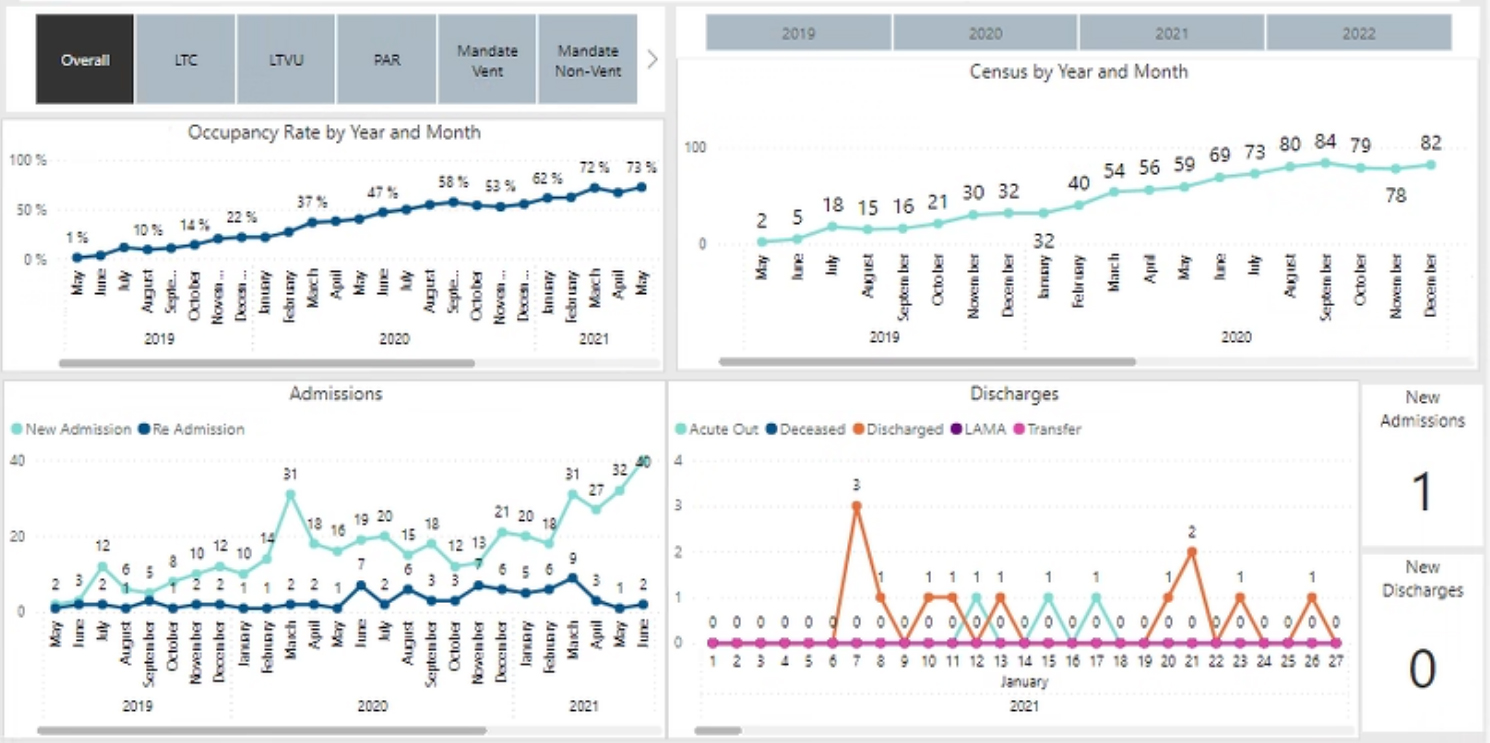 IP Census
 Service
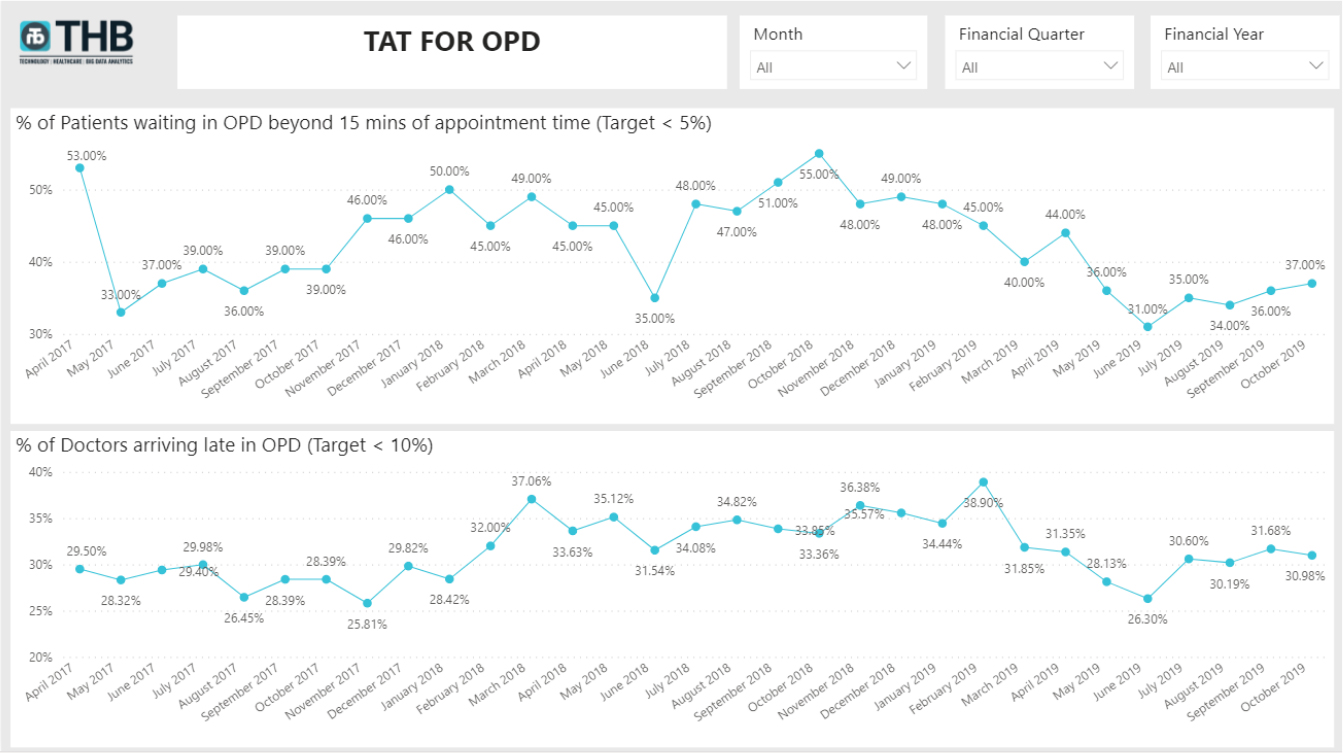
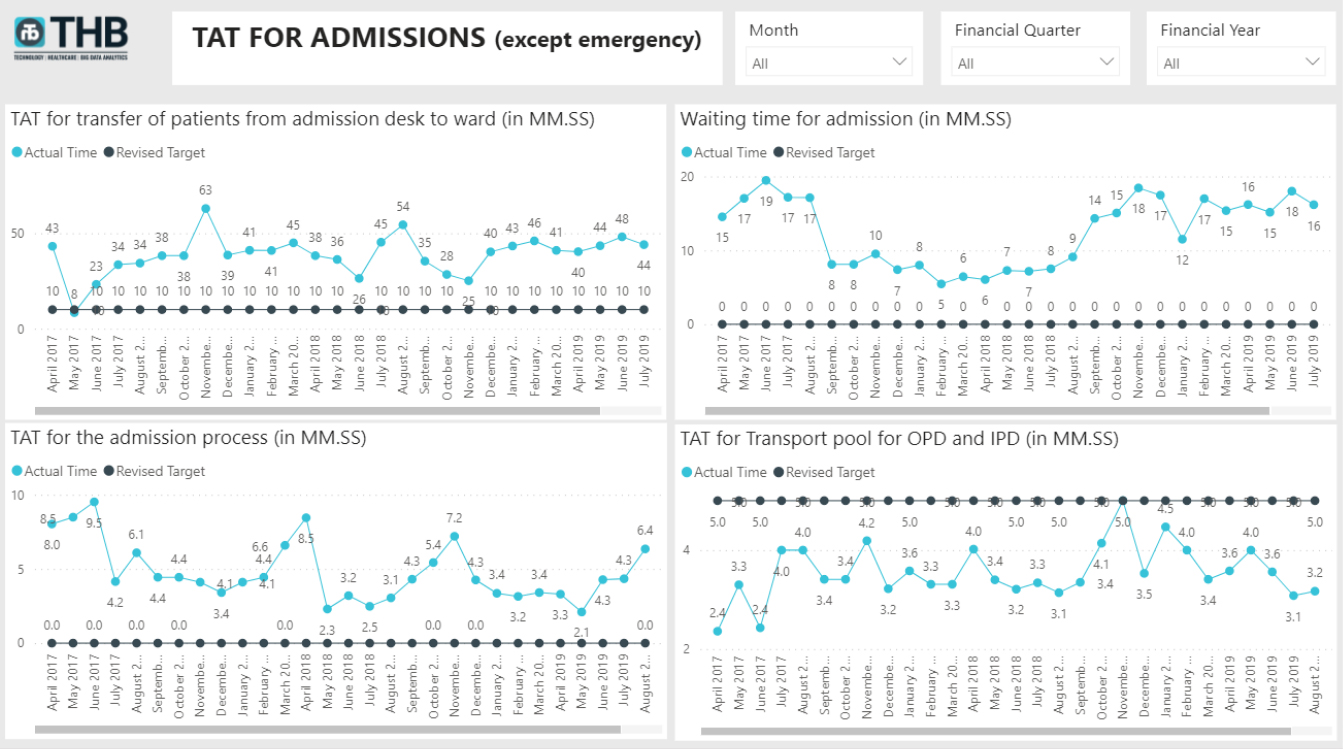 TAT for Admissions
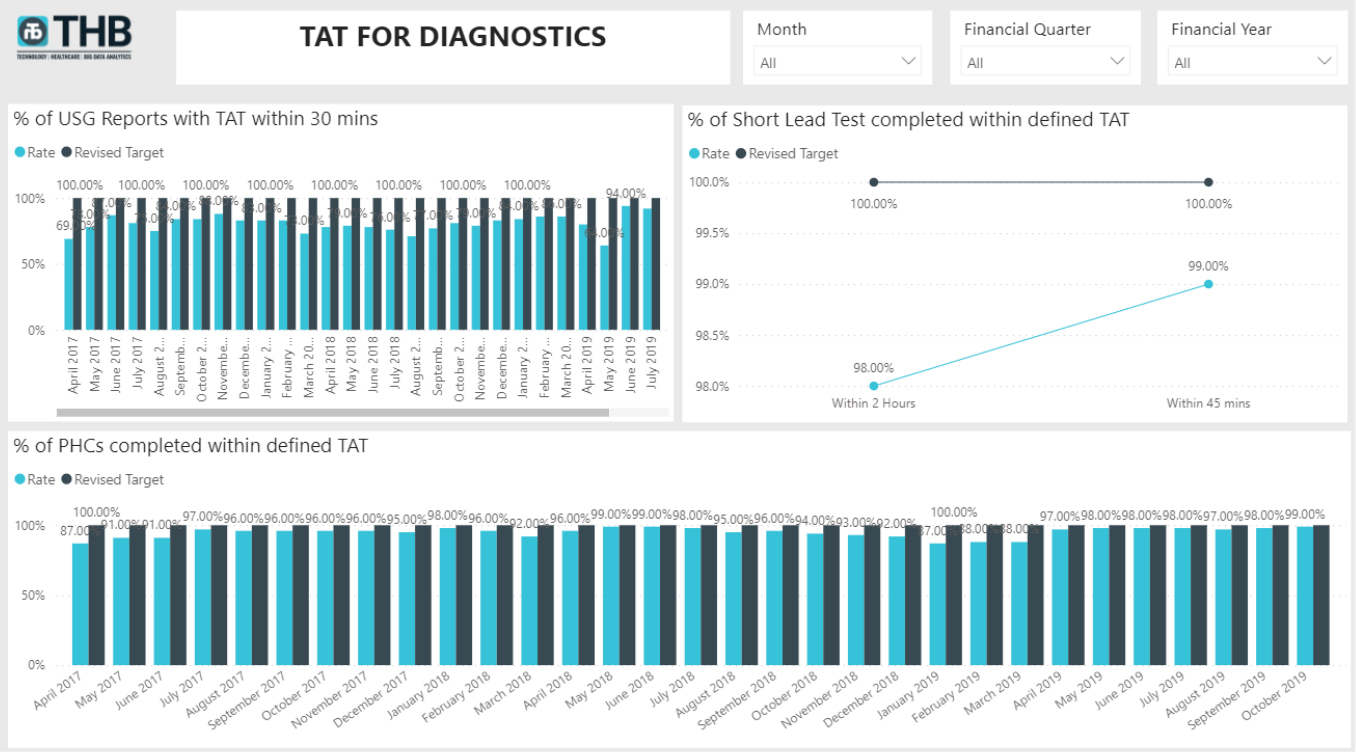 TAT Diagnostics
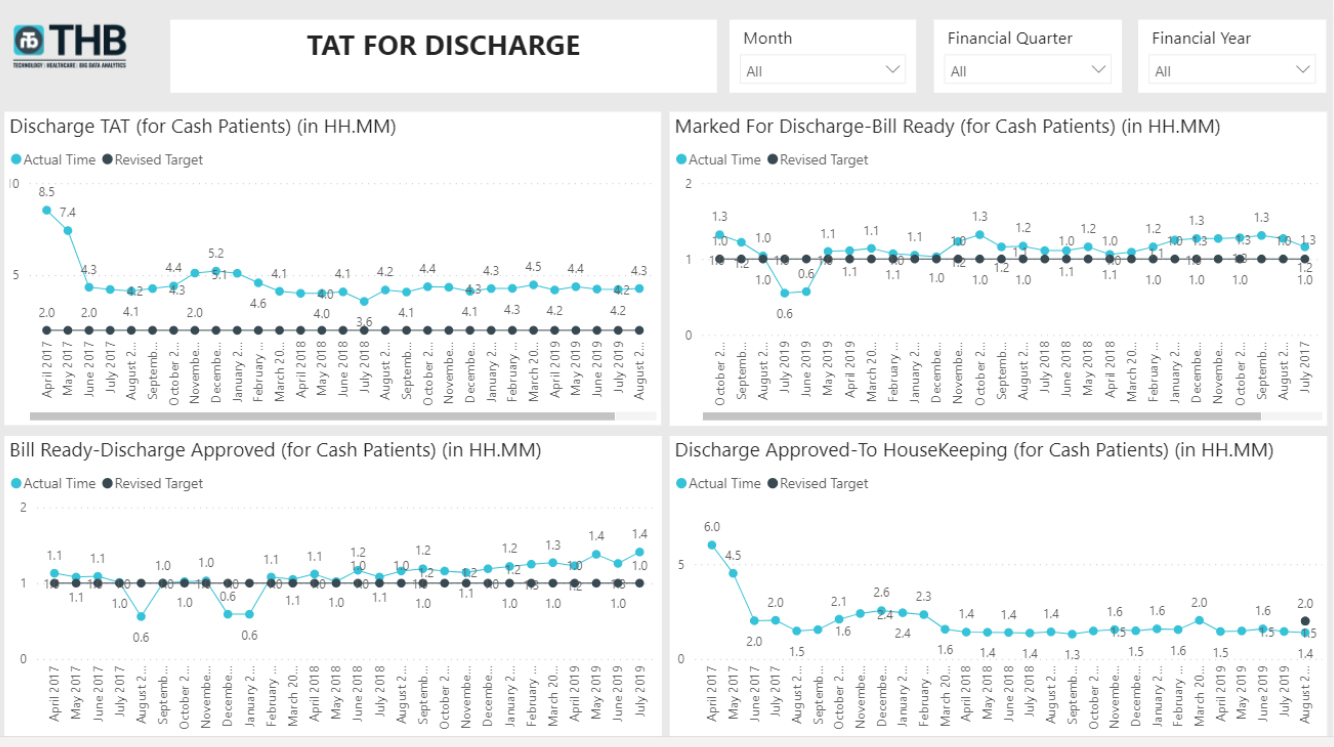 TAT Discharge
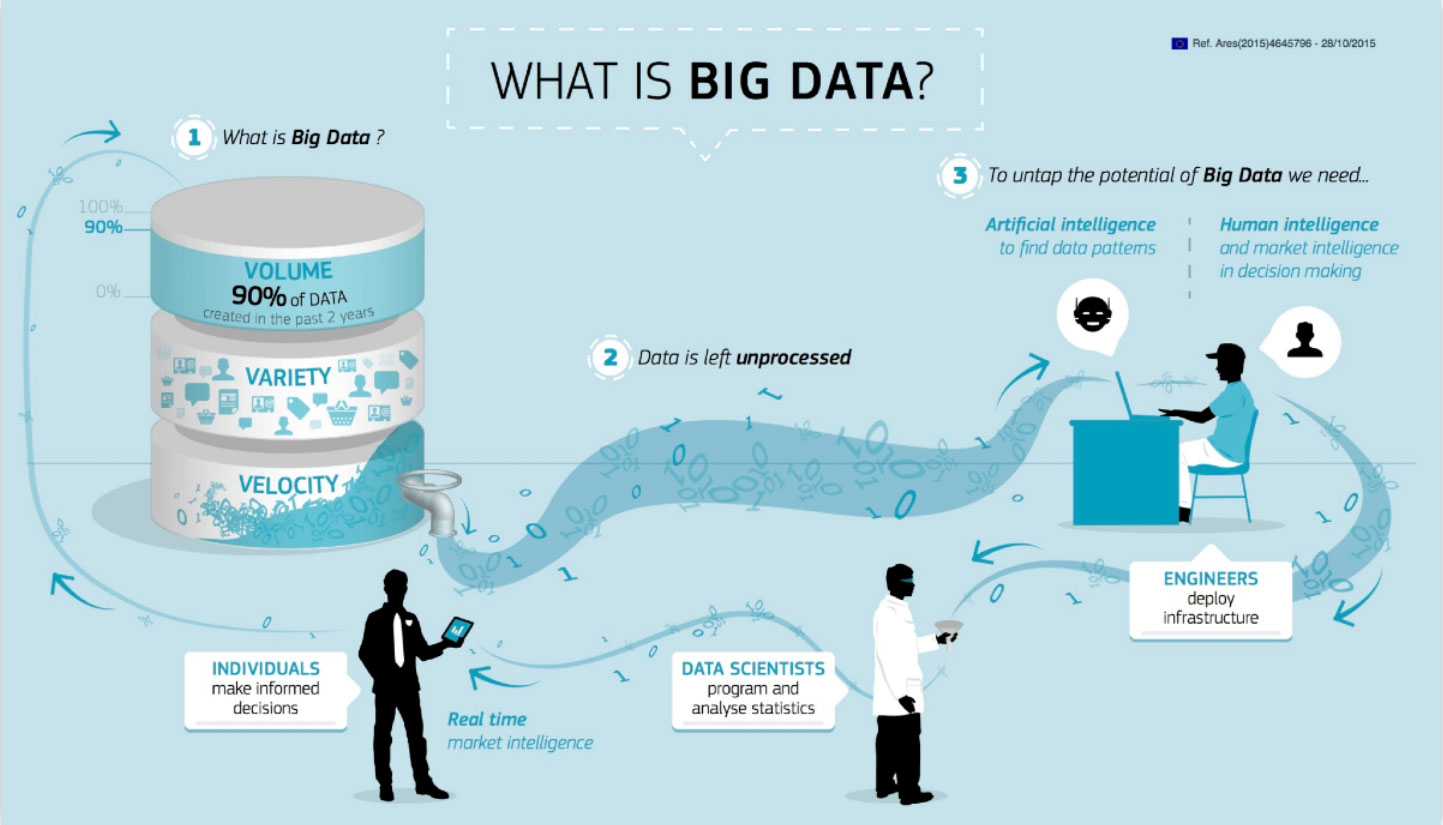
The emphasis has shifted from the sheer size of data to its intelligent management through the integration of advanced analytics. This approach enables hospitals to enhance patient care and services.
Data Visualisation
Visualisation across Power BI, Tableau, Apache Superset

Data Cubes

Organized data fields for Defined Use Cases
Processing Layer/Logic Layer

Python

Complex Business Logic
Unified Data Platform
Data Building

De-duplication Engine
-
Standardisation Engine

Investigations Dictionary

Diagnosis Dictionary

Drug/Condition Meta Tags
-
De-identification Engine
-
Hospital Information System
-
Lab Information System
-
ERP
-
Quality Management System
-
Any Other System
Automated Modules
-
Patient Suite
-
Doctors Suite
-
Analytics Suite
-
Analytics as a Service
Case Study: Achieved Clinical & Cost efficiency in performing surgical procedures
Dashboard Description: Provides comparison of clinical & operational efficiency parameters across doctors performing the same surgical procedure. Helps hospital management to assess clinical variance, identify areas of waste & streamline surgical performance
Variance for Lap Cholecystectomy, Private Insurance patients
Consumable Usage Variance by Unit/Doctor
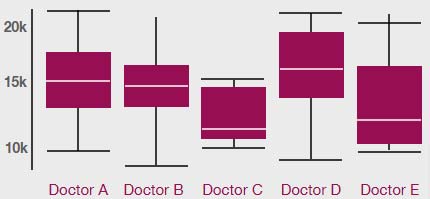
Plot diagrams provide the average, highest and lowest amount of consumables used /no. of tests prescribed by surgeons performing the same procedure for the same cohort of patients
Doctors Payout
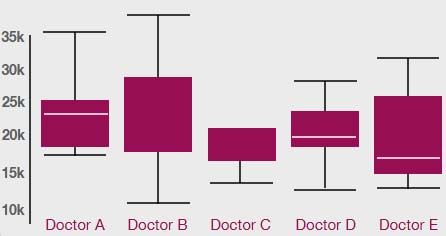
After comparing the clinical efficiency of surgeons, doctor payout graph can be used to assess if a more efficient doctor is being compensated/incentivized better
Advantage
- ~15-20% reduction in average usage of surgical consumables and no. of investigations through continuous monitoring using the dashboard & defining standard surgical kits for surgeries
- Improved adherence to best clinical practices
- Increased patient satisfaction due to rational prescription & optimum length of stay at hospital
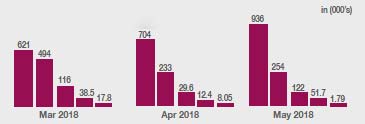
Case Study: Enhanced per patient revenue realization across departments
Dashboards Description: ‘Revenue loss’ dashboard provides details of the income and volume which the hospital has lost from OPD patients; ‘What did not work well’ dashboard gives in-depth analysis of the specialties which show de-growth, and the reasons for the same
Revenue Analysis Dashboard
Least performing specialties by Revenue
| 1 | Metric | Rev May 2018 | YoY | YoY Diff | YoY % Change | Cont to Total Rev |
|---|---|---|---|---|---|---|
| 2 | Others | 198M | 192M | 6.23M | 3% | 56% |
| 3 | Heart Center | 45.8M | 51.6M | -5.78M | -11% | 13% |
| 4 | Medical Onco | 35.9M | 41.3m | -5.43M | -13% | 10% |
Admission Volume Loss
| 1 | Metric | Rev May 2018 | YoY | YoY Diff | YoY % Change | Cont to Total Rev |
|---|---|---|---|---|---|---|
| 2 | Others | 198M | 192M | 6.23M | 3% | 56% |
| 3 | Heart Center | 45.8M | 51.6M | -5.78M | -11% | 13% |
| 4 | Medical Onco | 35.9M | 41.3m | -5.43M | -13% | 10% |
Detailed analysis of specialities which show revenue decline. Helps the leadership team in idenstifying the caused for de growth, and focus on the appropriate payer channels and case mix, rather than a general marketing approach.
ARPOB Loss
| 1 | Metric | Rev May 2018 | YoY | YoY Diff | YoY % Change | Cont to Total Rev |
|---|---|---|---|---|---|---|
| 2 | Others | 198M | 192M | 6.23M | 3% | 56% |
| 3 | Heart Center | 45.8M | 51.6M | -5.78M | -11% | 13% |
| 4 | Medical Onco | 35.9M | 41.3m | -5.43M | -13% | 10% |
Payer wise revenue Loss
| 1 | Metric | Rev May 2018 | YoY | YoY Diff | YoY % Change | Cont to Total Rev |
|---|---|---|---|---|---|---|
| 2 | Others | 198M | 192M | 6.23M | 3% | 56% |
| 3 | Heart Center | 45.8M | 51.6M | -5.78M | -11% | 13% |
| 4 | Medical Onco | 35.9M | 41.3m | -5.43M | -13% | 10% |
OP Revenue Loss by Speciality
OP Volume Loss by Speciality
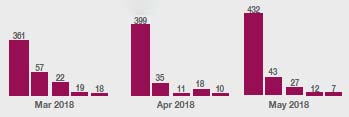
Understanding the service and specialty-wise loss of income and volume from out-patients helps in making process and marketing related changes to retain patients and increase the realization from support services such as diagnostics and pharmacy
Advantage
- Improved case mix
- Increase in ARPP (average revenue per patient) from existing specialties
- Higher patient retention and higher uptake of diagnostic services
- Focused marketing approach on specific payer channels and specialties